 The two publicly traded heavyweights in the prepaid debit card industry reported first quarter 2011 earnings over the last week, with Green Dot (NYSE: GDOT) reporting on April 28, 2011 and NetSpend (NASDAQ:NTSP) reporting on May 5, 2011. Both companies showed increasing revenues and net income. But how do they compare on some of the key metrics which suggest how their prepaid card issuance is trending?
Both Green Dot and NetSpend reported good financial numbers, with Green Dot reporting a 33% increase in non-GAAP total operating revenues to $123.2 million, and a 27% increase in non-GAAP net income to $17.5 million and non-GAAP diluted earnings per share of $0.39 (with both increases from the same quarter in 2010).
NetSpend showed an increase of 68% over net income of $4.6 million from the same quarter in 2010. NetSpend revenues were $80.8 million for the quarter ended March 31, 2011, an increase of approximately 16% over the $69.5 million of revenues recorded in the same quarter of 2010.
But how are some of the underlying metrics which show how their respective prepaid card bases are growing?
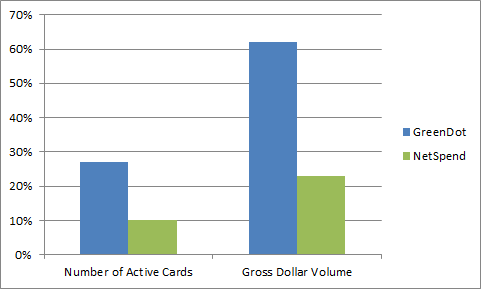
Here’s a visual comparison of two of the primary metrics we look at: the number of active cards (measured at the end of the quarter), and the gross dollar volume loaded on active cards. Both of these metrics indicate how each company’s issuance efforts are going (good distribution and issuance should show an increasing number of cards activated), and how the deposit base looks (a higher gross dollar volume is good, as these companies make fee income based on transactions and use, and loaded funds are needed to get to those fees).

Both companies show increases in the number of active cards and gross dollar volume as compared to the prior year’s first quarter. However, Green Dot shows a significant increase in both metrics: almost 30% increase in the number of active cards and over 60% increase in gross dollar volume.
Green Dot’s comment on this increase is that our “results in the first quarter show that our customers continue to incorporate our products into their everyday lives and are using them more frequently. An example of that is our 62% year-over-year increase in GDV to $4.6 billion in Q1 2011. This increase far outpaced the growth in our active cards and cash transfers because customers are increasing the average amount of money that they load to their cards.” Green Dot’s cards include cards like the Green Dot MasterCard, and the WalMart MoneyCard.
While NetSpend’s increases were not as significant as Green Dot’s, NetSpend did announce a new program that could give both numbers a boost in the coming year. NetSpend announced that they have entered into a new strategic alliance with BET Networks, the leading provider of media and entertainment for African Americans, to provide financial solutions to its audience. According to NetSpend, NetSpend and BET are jointly developing a general purpose reloadable card program to serve underbanked African American consumers in the U.S. The program will be marketed through BET’s media channels, which include cable networks that combined reach over 90 million U.S. households.
Comments are closed